SUMMARY OF 2022 COVID-19 DEATH STATISTICS
November 2022 Release
The first Michigan resident COVID-19 death was reported on February 25, 2020, and by the end of the 2022, 30,924 residents had died of the virus. As of December 31, 2022, the number of male deaths was 17,052 and the number of female deaths was 13,845. The age-adjusted rate of coronavirus deaths was 86.5 per 100,000 persons in 2020 and increased to 106.9 in 2021, with the largest deaths occurring in winter of both years. In 2022, the age-adjusted death rate declined to 45.0 per 100,000. Male COVID-19 age-adjusted rates were about 60% higher than female rates. Men died at a rate of 109.8 per 100,000 males in 2020, 135.1 in 2021 and 55.6 in 2022; women died at a rate of 68.1 per 100,000 females in 2020, 84.3 in 2021 and 37.3 in 2022.. (See Number and Rate of COVID-19 Deaths by Sex & Race, 2021.) In addition to causing 30,924 deaths outright, COVID-19 also contributed indirectly to 5,495 Michigander deaths who were already sick. Therefore, the number of those dying due to COVID-19, either due to the underlying cause of death, or as a related cause of death, was 36,419.
Figure 1 charts all COVID-19 deaths during 2020 to the first half of 2023. At the beginning of the outbreak, 3,792 people died in April, followed by a second major spike of 5,477 deaths between November and December. A third spike occurred between March to June 2021, when 3,605 Michigan residents died of COVID-19. The last major spike started in Fall 2021; between September 2021 to February 2022, 10,834 Michigan residents died of the coronavirus. Large spikes of covonavirus excess deaths did not occur in Spring and Summer of 2023.
Michigan Residents, January 1, 2020-July 2,2022
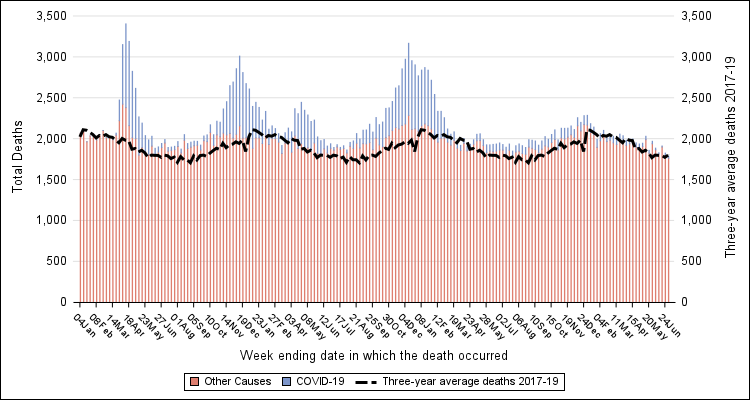
During March and April of 2020, Figure 1 shows a large spike in mortality that was not reported as COVID-19 deaths. Michigan's Division for Vital Records & Health Statistics (DVRHS) suspects that these excess deaths were mostly due to COVID-19. Because standardized federal coding guidance was not completely desiminated in March and during April1, COVID-19 deaths were sometimes reported as pneumonia deaths or deaths due to respiratory aspiration instead. However, long after the coding guidelines were firmly established, between November 2021 to January 2022, there was another spike in excess deaths not attributal to COVID-19. Excess deaths included increases in homicides, stroke, accidents and drug-induced mortality. (For specific Michigan mortality trends, see Homicide, Stroke, Accident or Drug-Induced mortality age-adjusted rates, 1989-2022.)
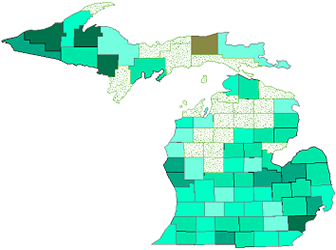
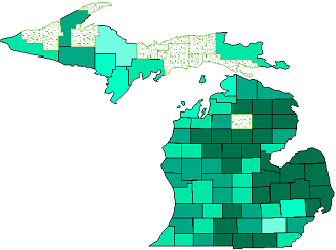
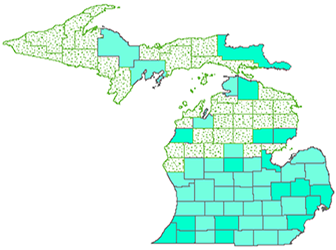
Michigan Counties and Health Districts. In 2022, COVID-19 deaths predominately occurred in the southern half of Michigan's lower peninsula (LP). With the exception of Oceana County, southern LP counties suffered mortality rates between 25.6 (Washtenaw) to 67.7 (Bay) deaths per 100,000. In addiition to Bay County Health Department, Lapeer County HD (61.8), Detroit CIty HD (64.4) and St. Clair (58.2) all exhibited high COVID-19 mortality rates on the eastern side of the state. At at death rate of 57.5 deaths per 100,000, Van Buren-Cass Health Deparments coronavirus mortality rates were highest on the west side of the state.
Figure 2 shows the pattern of rising COVID-19 rates of death starting with pandemic in 2020, the apex of coronavirus deaths in 2021 and the decline of the deaths rates in 2022.
. (See Number and rate of COVID-19 deaths by health district.)
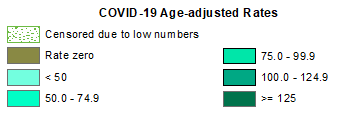
| Figure 2. COVID-19 Age-adjusted Mortality Rates by County Michigan Residents, 2020, 2021 and 2022 |
||
|---|---|---|
|
|
|
|
||
Race, Sex and Age. Almost 80% of all the COVID-19 deaths reported were White deaths who died at a rate of 41.8 per 100,000 White population. Black deaths comprised about 15% of the reported coronavirus deaths and the mortality rate was 61.1 per 100,000 Black population. About 3% of the coronavirus deaths were those with Hispanic ancestry; the Hispanic mortality rate was 49.6 per 100,000. (See COVID-19 deaths and rates by race & sex.)
By Race or Hispanic Ancestry
Michigan Residents, 2022
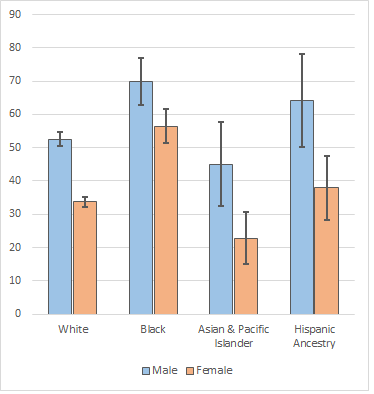
COVID-19 mortality rates were almost always higher for men than women among every age group and among every race. The rates follow a staircase pattern by age; younger persons were much less likely to die of COVID-19, while older age-groups had very high rates. For example, black men under age 55 died at a rate of 10.2 per 100,000 and black men over age 84 died at a rate of 1,422.4 per 100,000. White men under age 55 died at a rate of about 7.4 per 100,000 and Hispanic males over 84 died at a rate of 1,352.2 per 100,000. (See COVID-19 Deaths and age-specific rates by race, sex & age..)
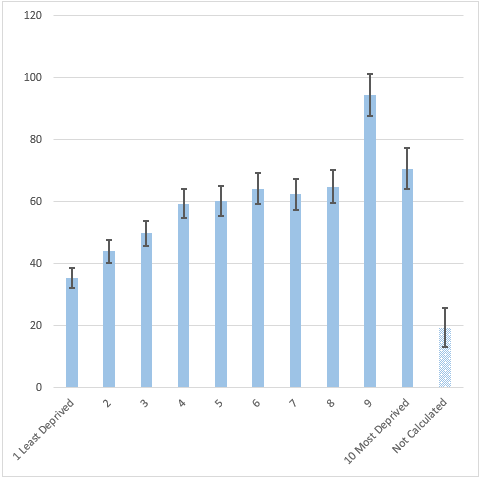
Area Deprivation Index. Area Deprivation Index2 (ADI) uses American Community Survey data--income, education, employment, and housing quality--to measure neighborhood quality. Figure 4 shows crude rates by ADI. The rates grow increasingly higher as neighborhood quality decreases. (See Number and Rate of COVID-19 Deaths by Area Depriviation Index.)
Michigan Residents, 2022
Other Causes of Death. In 2022, the Michigan COVID-19 age-adjusted rate was 45.0 per 100,000, and dropped to the fourth leading cause of death from third in 2020-2021. Certain causes of death were often listed as a secondary causes, co-morbidities, or related causes of death to COVID-19. Pneumonia and flu were listed as a COVID-19 related cause of death 61% of the time; heart disease was listed about 29% of the time; and Nephritis, Diabetes and Septicemia or other diseases were listed less frequently. (See COVID-19 deaths and related causes of death.)
Other than COVID-19 deaths, certain causes of death changed significantly as compared to the three-year average 2017-2019 rates. Among the causes of death commonly calculated, diabetes-related mortality rates grew from 66 per 100,000 (2017-2019) to 88.8 (2020) and 91.9 (2021) and then to 82.4 (2022)—a 40% increase in 2021 and 25 increase in 2022 as compared to pre-pandemic levels. Homicides increased by 35% in 2022, compared to the 2017-2019 average. Stroke deaths rose by 11%. Suicide rates decreased by 3.5% in 2020 but by 2021, the suicide rate is about the same as before the pandemic. Suicide rates had risen from 1999 to 2018; and 2019 and 2020 rates, though decreasing, are still very high compared to rates 20 years ago. Some selected causes of mortality are listed in the table below.
| Cause of Death | Age-adjusted Rate 2017-2019 |
2020 | 2021 | 2022 | |||
|---|---|---|---|---|---|---|---|
| Rate | % Change | Rate | % Change | Rate | % Change | ||
| Heart Disease | 195.0 | 206.0 | 5.6 | 209.5 | 7.4 | 205.4 | 5.3 |
| COVID-19 | — | 86.5 | — | 106.9 | — | 45.0 | — |
| Diabetes-related | 66.0 | 88.8 | 34.5 | 91.9 | 39.2 | 82.4 | 24.8 |
| Unintentional Injuries | 51.8 | 56.2 | 8.5 | 61.8 | 19.3 | 59.2 | 14.3 |
| Stroke | 39.5 | 44.8 | 13.4 | 46.1 | 16.7 | 44.0 | 11.4 |
| Alzheimer's Disease | 34.3 | 37.0 | 7.9 | 34.4 | 0.3 | 32.4 | -5.5 |
| Diabetes Mellitus | 22.1 | 26.3 | 19.0 | 26.7 | 20.8 | 25.6 | 15.8 |
| Pneumonia/Influenza | 13.8 | 14.4 | 4.3 | 10.4 | -24.6 | 11.0 | -20.3 |
| Intentional Self-harm (Suicide) | 14.3 | 13.8 | -3.5 | 14.3 | - | 14.6 | 2.1 |
| Homicide | 6.3 | 8.6 | 36.5 | 8.7 | 38.1 | 8.5 | 34.9 |
![]()
Community Level Data: COVID-19 is a leading cause of death for 2020-2022, and so the coronavirus mortality statistics are also integrated into the leading causes of death tables throughout the division's website. In particular, COVID-19 data can be found in the community level Mortality Characteristics by Race website.
Questions regarding COVID-19 Death Statistics should be directed to:
Lindsey Myers
Division for Vital Records & Health Statistics
Michigan Department of Health & Human Services
333 S. Grand Ave.
Lansing, MI 48933
E-mail: [email protected]
![]()
1Centers for Disease Control and Prevention. National Vital Statistics System: Guidance for Certifying COVID-19 Deaths 2020. https://www.cdc.gov/nchs/data/nvss/coronavirus/Alert-1-Guidance-for-Certifying-COVID-19-Deaths.pdf (accessed 4/20/2020 2020).
2Source Neighborhood Atlas - Home (wisc.edu) Kind AJH, Buckingham W. Making Neighborhood Disadvantage Metrics Accessible: The Neighborhood Atlas. New England Journal of Medicine, 2018. 378: 2456-2458. DOI: 10.1056/NEJMp1802313. PMCID: PMC6051533. AND University of Wisconsin School of Medicine Public Health. 2015 Area Deprivation Index v2.0. Downloaded from https://www.neighborhoodatlas.medicine.wisc.edu/ November 4, 2021.