Birth Defects Prevalence and Mortality Tables
Division for Vital Records & Health Statistics
Michigan Department of Health & Human Services
The Michigan Birth Defects Registry was established as a statewide reporting system in
1992 to develop statistical data on birth defects; to conduct birth defect surveillance;
to conduct studies of birth defect causes and prevention; and to insure the families of
children with birth defects receive appropriate support services.
This web page provides a series of tables with birth defect prevalence and mortality data through 2019 for the State of Michigan, Michigan counties and local health department districts. Local area data can be viewed at Community Health Information Birth Defects Site.
Selected high points concerning these data are:
- Birth Defect Cases and Case Rates
In the years 2018 and 2019, there were 14,544 and 15,561 cases of birth defects reported for children under one year of age, respectively. The 2018-2019 average rate was about 1,381 cases per 10,000 resident live births. Not all birth defects are reported when the child is an infant, and for those born during 2019, there was an additional 1,146 cases reported for children in the second year of life. Therefor, for infants born in 2019, there were 1,548.1 birth defects per 10,000 resident live births. Between 2015 to 2019, the five-year average prevalence rate for two-year olds based upon reported cases was about 1,249.2 per 10,000 live births. Because birth defect prevalence rates tend to be osculatory in nature, it can be difficult to detect an overall trend from recent data. However, it should be noted that the birth defect rates in 2014, 2018 and 2019 are the highest birth defects rates reported in a decade. (See Birth Defects Cases and Case Rates.)
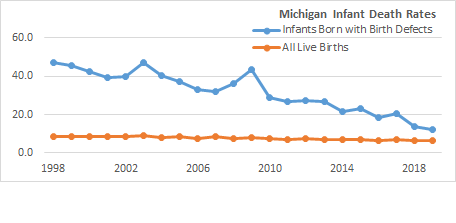
- Infant Death Rates
In 2019, infants born with a birth defect were over 2 times more likely to die than other infants. The infant death rate for children born in 2019 with a reportable birth defect was 12.2 per 1,000, but the overall infant death rate was 6.6 per 1,000 resident infants born in Michigan during the same year. Birth defect mortality rates are showing a gradual, uneven decline since the 1990s and 2000s, even though birth defect prevalence rates are not declining. (See Mortality Rates Among Children.)
- Mortality Risk
A higher mortality risk can be expected for children with birth defects well beyond the first year of life. The cumulative mortality rate for resident children under 5 years of age born during 2015 was 8.0 per 1,000. Children born during 2015 with a birth defect had a cumulative mortality rate of 26.4 per 1,000 by the end of the fifth year of life. The mortality rate differential remains high throughout early childhood. For children under the age of 18 years, the mortality rates for children born with birth defects are almost 5 times higher than other children; 52.8 per 1,000 for children with birth defects versus 12.0 per 1,000 for children generally. The significantly higher mortality rate for children with birth defects underscores the seriousness of these conditions. (See Cumulative Mortality Among Children.)
- Birth Defects By Diagnostic
Code Groups
The two most common diagnostic categories reported in 2019 were musculoskeletal system defects (2,523 cases) and heart and circulatory system defects (2,936 cases). Genital and urinary systems defects were also very high at 2,091 cases. Congenital anomalies of the integument remained above 1,000 cases for the last five years, but rising to t 2,106 in 2019; close to the 10 year high in 2014 of 2,249 cases.. (See Birth Defects by Diagnostic Code Group by Birth Year.)
With regard to mortality, the number of deaths between 2017-2019 for children with heart and circulatory anomalies was 312, about 3 times that of other leading causes of birth defect related deaths. Infant mortality rates were highest for the chromosomal anomalies (73.1 per 1,000 born with the defect) and for central nervous system anomalies (54.4 per 1,000), based upon mortality among the 2017-2019 birth cohorts. (See Infant Deaths to Michigan Children with Reported Birth Defects and Mortality Rates.) Mortality rates averaged over six years allow for the stable estimates of birth defect death rates by detailed diagnositic code groups. Birth defects mortality were highest for certain rare congenital anomalies: Anencephalus was 900 per 1,000, Trisomy 13 (Patau Syndrome) was 750 per 1,000 and Trisomy 18 (Edward Syndrome) was 576.5 per 1,000. (See Mortality Rates of Michigan Children with Reported Birth Defects by Detailed Diagnostic Code Group.)
Tables describing detailed condition information also include numbers.
There are
three potential sources of error in these data, especially at the county level:
- Data are based on passive reporting which means it is the responsibility of facilities to identify and report cases of birth defects. Not all facilities report cases as completely and timely as would be the ideal.
- Some facilities report children with a birth defect that is later "ruled out" resulting in an over count of the actual number of cases.
- Children diagnosed and treated in facilities in other states may be missed which will significantly affect the completeness of data for Michigan�s border counties.